Dashboard
The EZ Cloud Dashboard provides real-time visibility into your accounts payable operations. Access it from the main navigation by clicking the Dashboard icon.
The dashboard is organized into four tabs, each focusing on different aspects of your AP workflow:
- Overview - Real-time status and daily activity
- Invoice Statistics - Detailed invoice metrics and trends
- Supplier Statistics - Supplier performance analysis
- Team Statistics - Team productivity and workload
Hover over the ⓘ icon next to any chart title to see a detailed description of what the chart measures.
Overview Tab
The Overview tab gives you an at-a-glance view of your current invoice status and recent activity.
Status Cards

Four key metrics displayed at the top:
| Card | Description |
|---|---|
| Pending | Invoices currently in the approval workflow awaiting action |
| Exceptions | Invoices flagged with validation issues requiring attention |
| Approved | Invoices that have completed the approval process |
| Auto Approved | Invoices automatically approved based on configured rules |
Auto-Refresh Feature
The dashboard automatically refreshes data at regular intervals to ensure you're always seeing the latest information. You can also manually refresh by clicking the refresh button in the top right corner.
Invoices Received
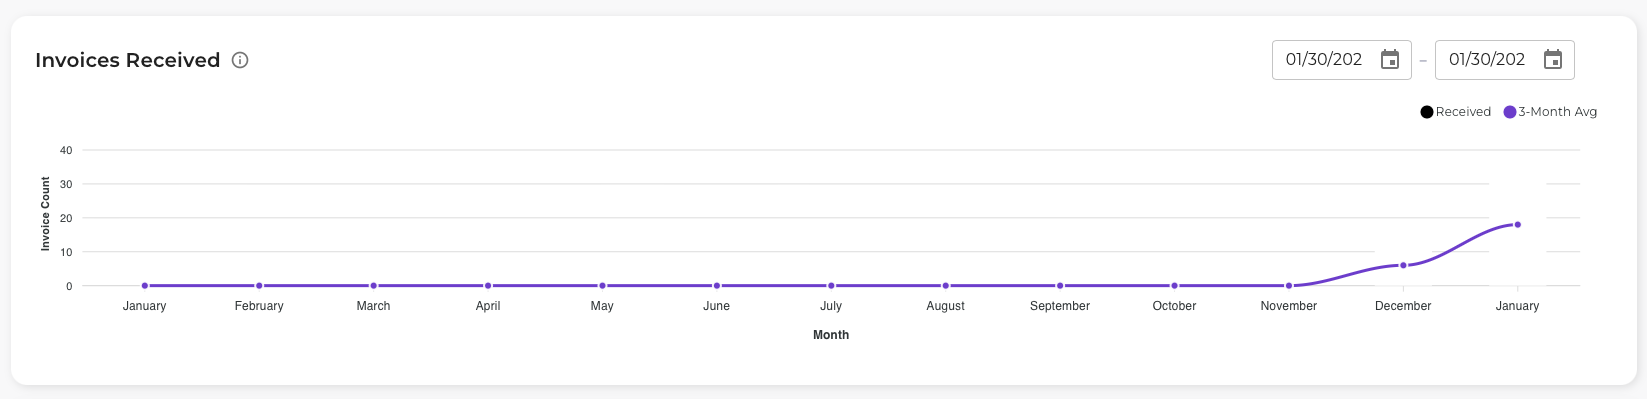
A line chart showing the volume of invoices received over time.
- X-axis: Time period (months)
- Y-axis: Invoice count
- Lines:
- Received - Actual invoices received
- 3-Month Avg - Rolling average to identify trends
Use the date picker in the top right to adjust the time range.
Use this to: Identify seasonal patterns, forecast workload, and detect unusual spikes in invoice volume.
Today's Invoice Activity by Hour
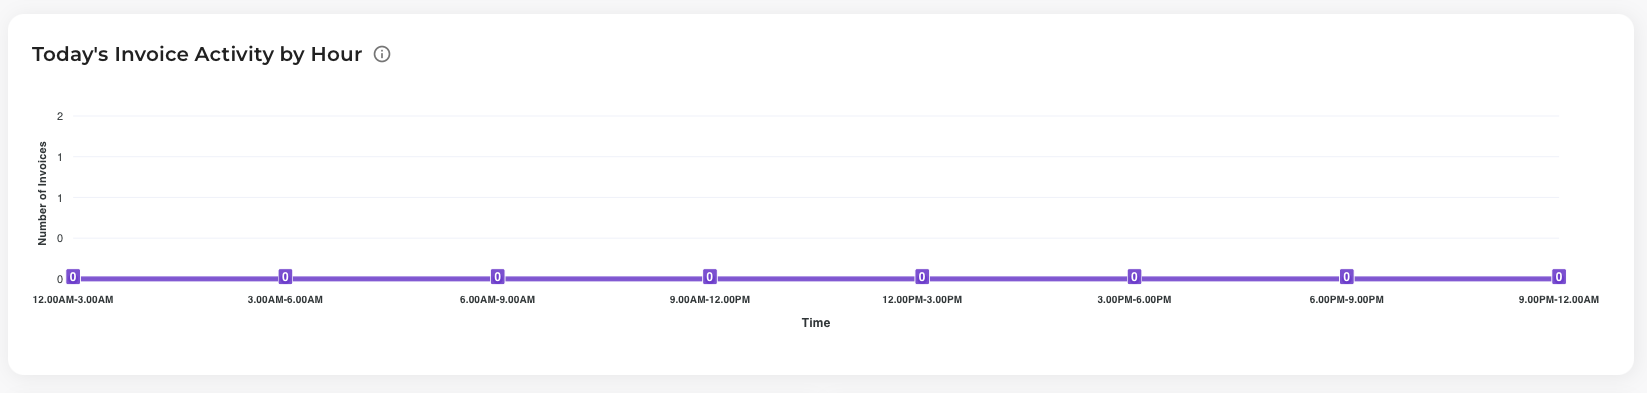
A bar chart showing when invoices are being received throughout the current day.
- X-axis: 3-hour time blocks (12:00AM-3:00AM, 3:00AM-6:00AM, etc.)
- Y-axis: Number of invoices
Use this to: Understand peak processing times and plan team coverage accordingly.
Weekly Pending & Exceptions
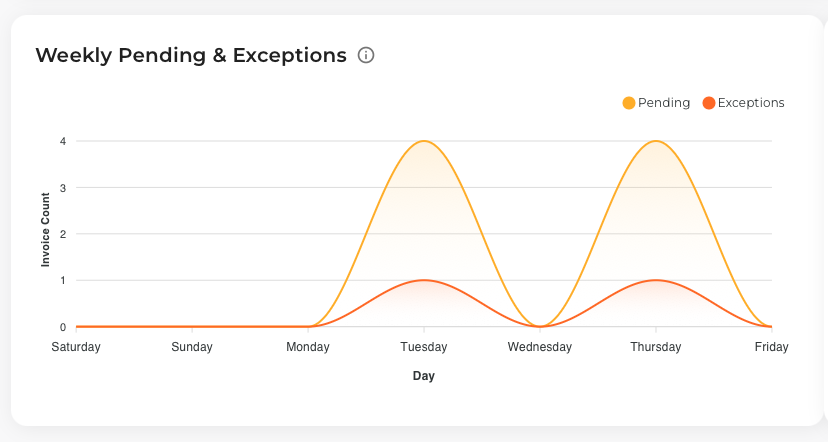
An area chart comparing pending invoices against exceptions over the past week.
- Yellow area: Pending invoices
- Orange line: Exception invoices
Use this to: Monitor exception rates and identify days with processing backlogs.
Weekly Received vs Approved
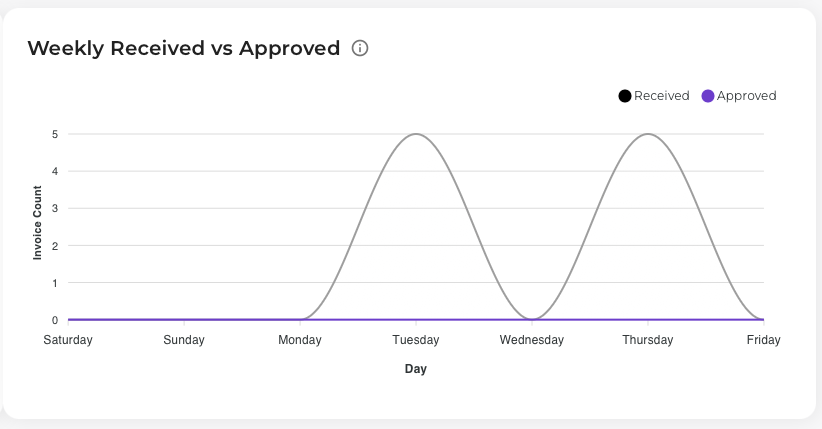
A line chart comparing invoice intake against approval throughput.
- Blue line: Invoices received
- Orange line: Invoices approved (pending)
Use this to: Ensure your team is keeping pace with incoming invoice volume. If the received line consistently exceeds approved, you may have a capacity issue.
Invoice Statistics Tab
The Invoice Statistics tab provides detailed metrics on invoice processing efficiency.
Summary Cards
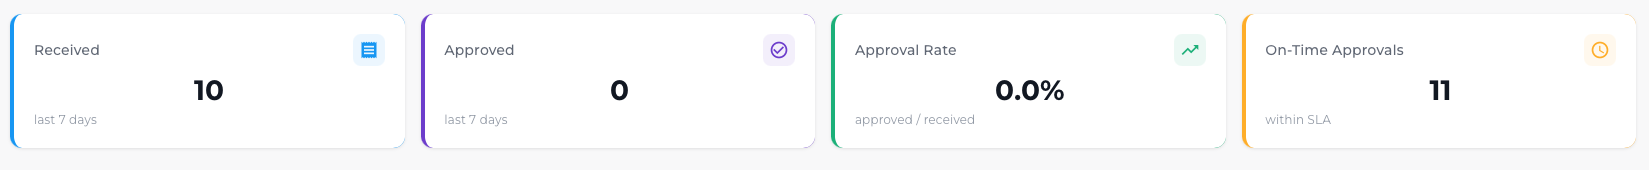
| Card | Description |
|---|---|
| Received | Total invoices received in the last 7 days |
| Approved | Total invoices approved in the last 7 days |
| Approval Rate | Percentage of received invoices that were approved |
| On-Time Approvals | Invoices approved within your configured SLA |
Invoice Turnover
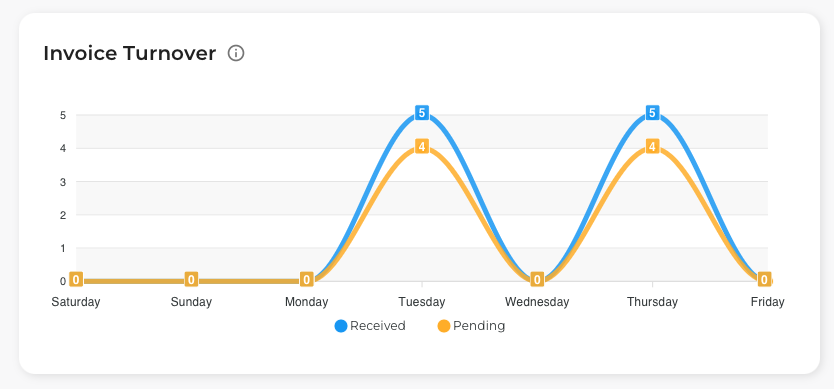
Compares the flow of invoices received versus those still pending.
- Blue line: Invoices received per day
- Orange line: Invoices pending at end of day
Use this to: Identify processing bottlenecks. Ideally, the pending line should track close to or below the received line.
Invoice Approval Status
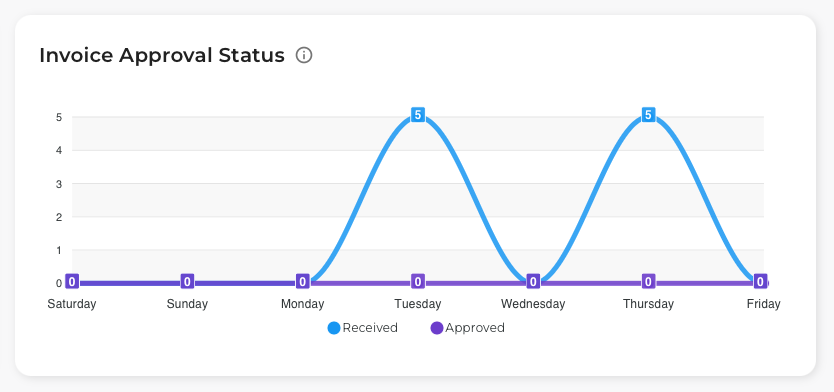
A breakdown of invoices by their current status in the workflow.
Use this to: Quickly identify where invoices are getting stuck in the approval process.
Invoice Approval Rate
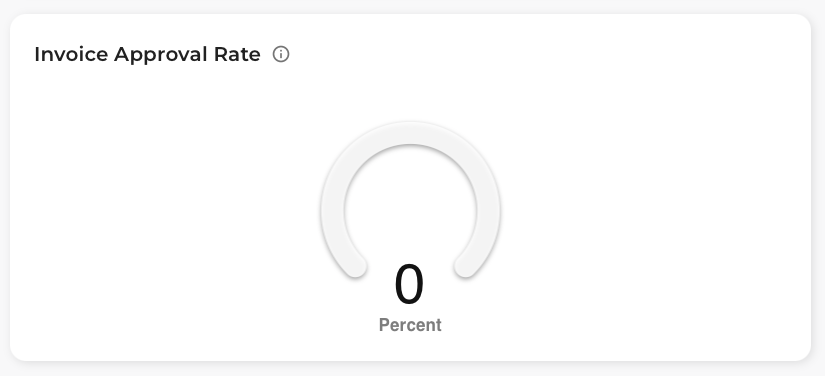
Shows your approval rate trend over time.
Use this to: Track approval efficiency and identify periods of declining performance.
Timely Invoice Approvals
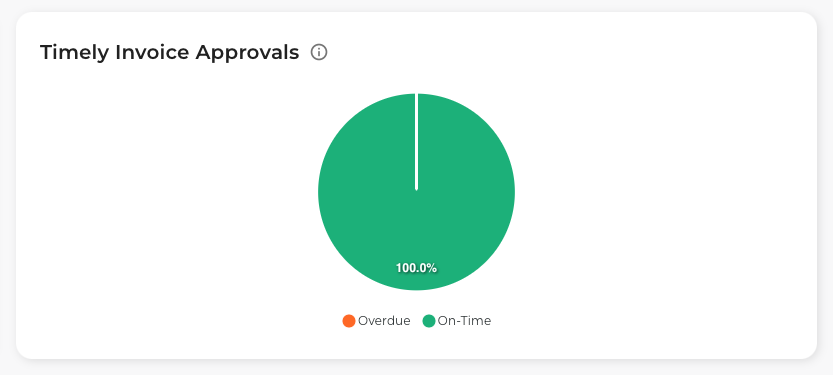
Measures how many invoices are being approved within your target SLA timeframe.
Use this to: Ensure your team is meeting service level agreements and identify process delays.
Exception Invoice Tracking
![]()
Detailed view of exception types and their resolution status.
Use this to: Understand the root causes of exceptions and prioritize process improvements.
Invoice Type (PO vs Non-PO)
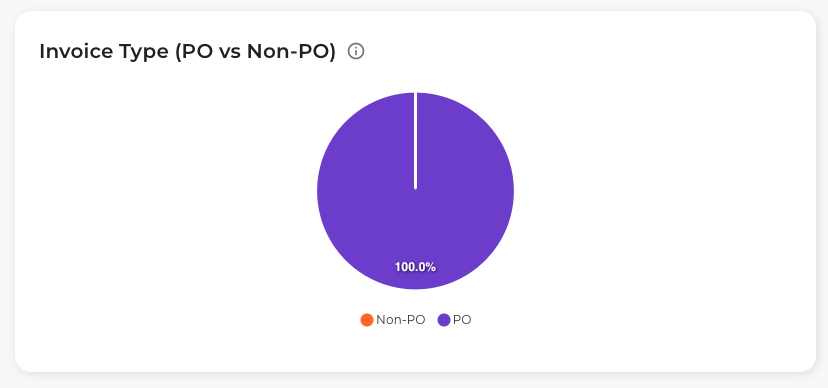
A pie chart showing the distribution of invoices by type:
- PO Invoices: Invoices linked to a purchase order
- Non-PO Invoices: Direct invoices without a purchase order
Use this to: Understand your invoice mix and tailor workflows accordingly.
Invoice Input Channels
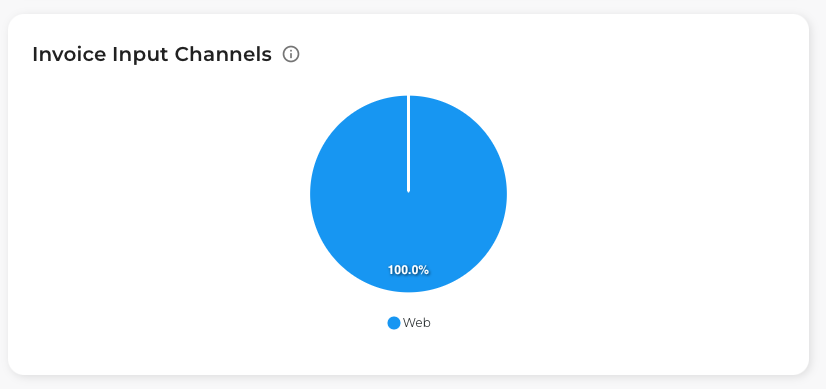
A pie chart showing how invoices are being submitted:
- Web: Manual upload through the web interface
- Email: Invoices received via email integration
- Supplier Portal: Submitted by suppliers directly
- Scanner: Physical documents scanned into the system
Use this to: Measure adoption of different intake channels and identify opportunities for automation.
Unapproved Invoice Status
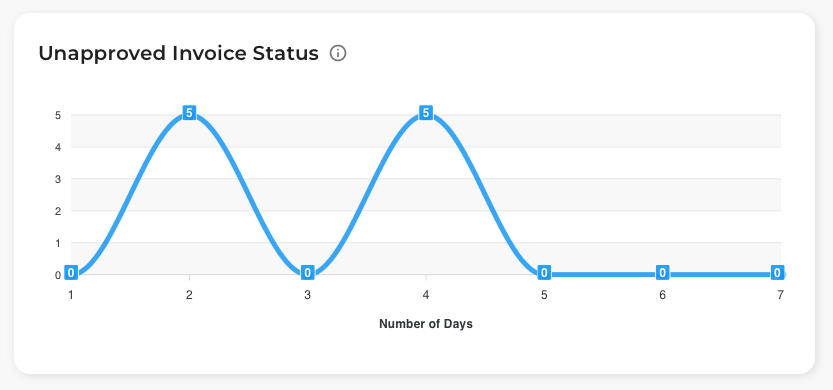
Shows the aging and status breakdown of invoices that haven't been approved yet.
Use this to: Identify stale invoices that need attention and understand approval bottlenecks.
Invoice Approval Limits
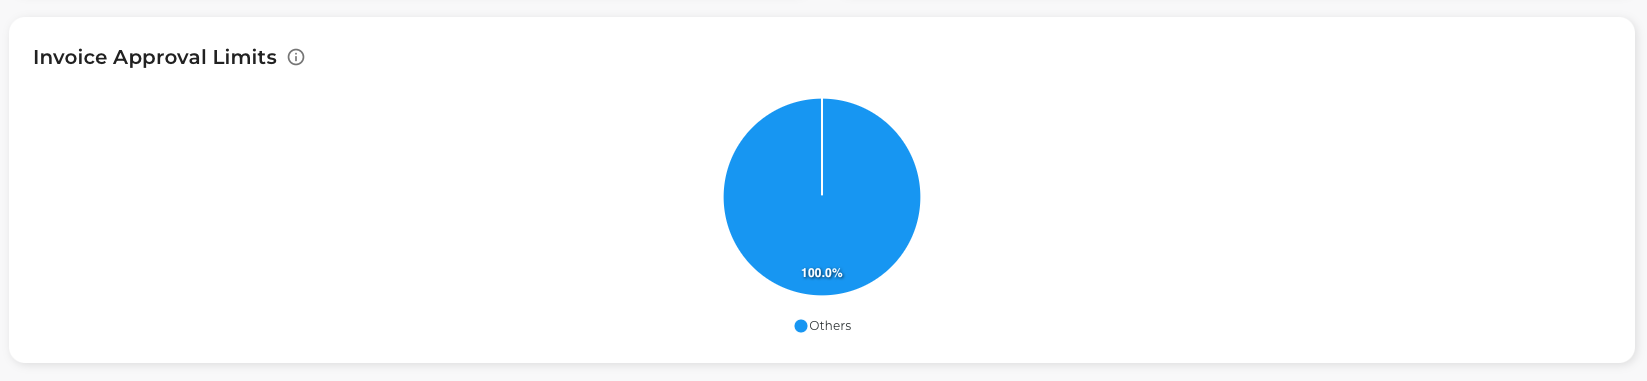
Distribution of invoices by amount ranges, helping you understand approval authority utilization.
Use this to: Ensure invoices are being routed to approvers with appropriate authority levels.
Supplier Statistics Tab
The Supplier Statistics tab helps you analyze vendor performance and identify problem suppliers.
Summary Cards
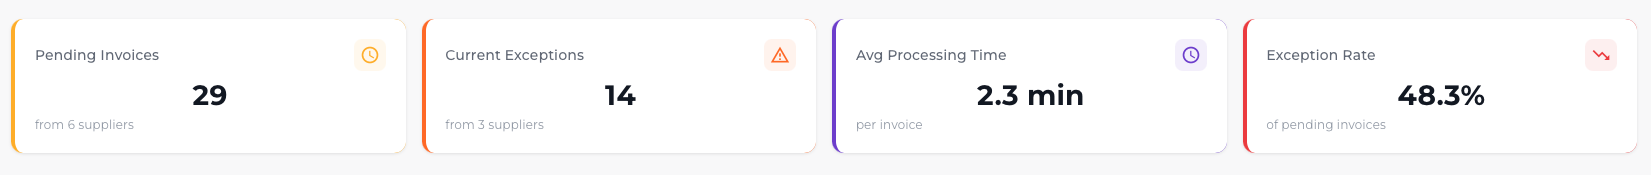
| Card | Description |
|---|---|
| Pending Invoices | Total invoices pending from all suppliers |
| Current Exceptions | Active exceptions grouped by supplier count |
| Avg Processing Time | Average time to process an invoice |
| Exception Rate | Percentage of invoices that become exceptions |
Pending Invoices by Supplier
Shows which suppliers have the most invoices awaiting approval.
Use this to: Identify suppliers that may need additional attention or communication.
Exception Invoices by Supplier
Ranks suppliers by the number of exception invoices they've submitted.
Use this to: Identify suppliers with recurring issues that may need training or updated submission processes.
Invoice Processing Time by Supplier
Average processing time broken down by supplier.
Use this to: Identify suppliers whose invoices take longer to process and investigate root causes.
Exception Rate by Supplier
Shows the percentage of each supplier's invoices that result in exceptions.
Use this to: Prioritize supplier outreach and identify candidates for supplier portal onboarding.
Team Statistics Tab
The Team Statistics tab provides insights into team productivity and workload distribution.
Summary Cards
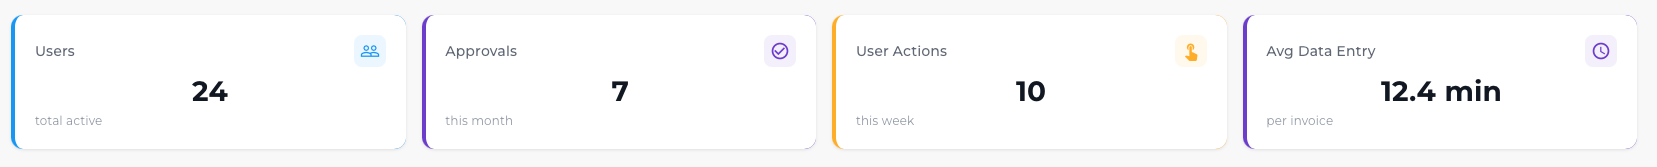
| Card | Description |
|---|---|
| Users | Total active users on the team |
| Approvals | Total approvals this month |
| User Actions | Total user actions this week |
| Avg Data Entry | Average time spent on data entry per invoice |
User Activity Tracking
![]()
A bar chart showing user activity levels throughout the week.
- X-axis: Day of the week
- Y-axis: Number of actions
Use this to: Identify peak activity days and ensure adequate coverage.
Team Role Distribution
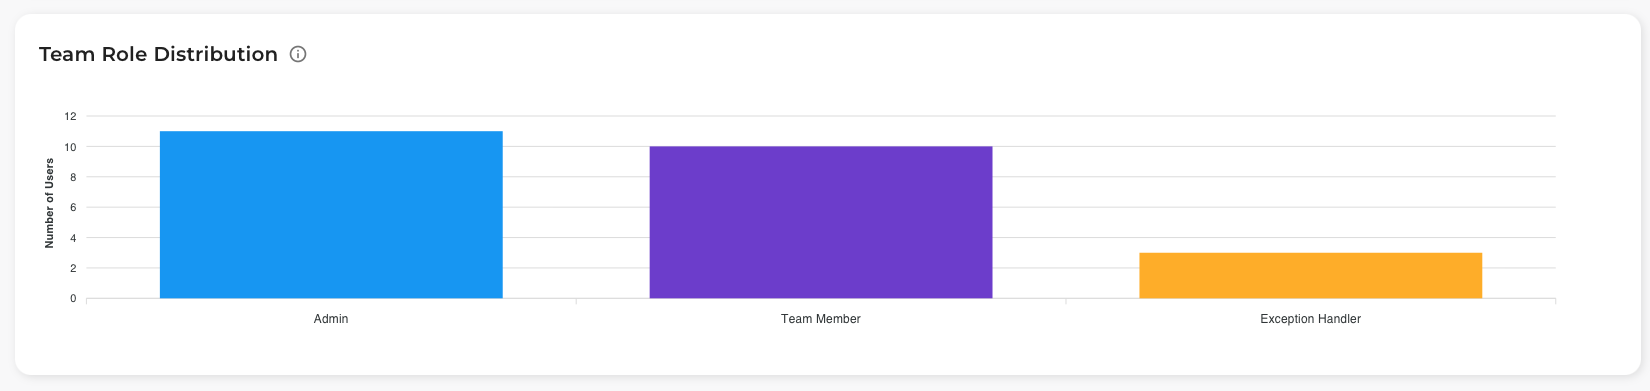
A bar chart showing how users are distributed across roles:
- Admin: System administrators
- Team Member: Standard approvers
- Exception Handler: Users handling exception resolution
Use this to: Ensure you have appropriate role coverage for your workflow needs.
Data Entry Metrics
Tracks the time and efficiency of data entry activities.
Use this to: Identify training opportunities and measure the impact of process improvements.
Approval Metrics
Detailed breakdown of approval activities by team member.
Use this to: Balance workload and identify top performers.
Distribution of Invoice Totals
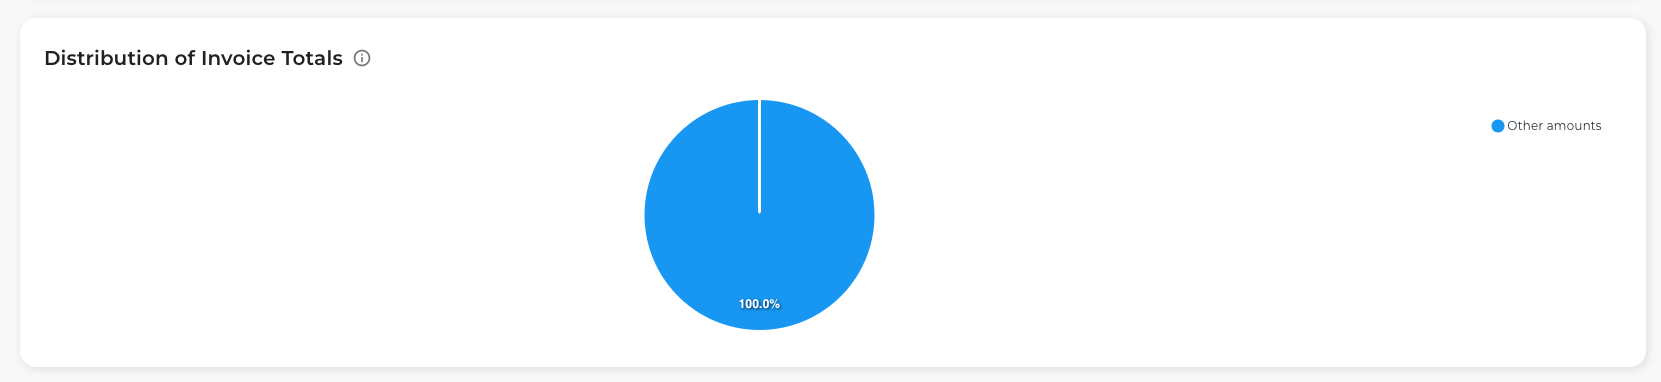
Shows the distribution of invoice amounts processed by the team.
Use this to: Understand the value of invoices being processed and ensure appropriate approval authority.
Best Practices
Daily Monitoring
- Check the Overview tab each morning to see pending work
- Review Exceptions count and address high-priority items first
- Monitor Today's Activity to plan your day
Weekly Review
- Compare Received vs Approved to ensure you're keeping pace
- Review Supplier Statistics to identify problem vendors
- Check Team Statistics to balance workload
Monthly Analysis
- Analyze Approval Rate trends over time
- Review Exception Rate by Supplier for supplier management
- Use Invoice Input Channels to measure automation progress